Ontario Parks reports where the colour was, roughly once a week. This site forecasts where it is going to be, every morning, with a dated peak window for each location and a confidence band we publish. It is run by Wilderness Union, a Toronto outdoor community whose guides are in these parks most weeks of the season, and the forecast is corrected daily by what they and our readers report from the ground. Everything on this page is generated from the live model, free to quote with credit to ontariofall.com and a link. If you need something that is not here, email us for a fast response.
Quotable
"The best fall colour in Ontario this weekend is at Frontenac, scoring 7.4 out of 10, with peak colour running Oct 18 to Oct 26, give or take 1.5 days." · ontariofall.com forecast, Oct 19
"Colour moves north to south across roughly a month. The earliest predicted peak this year is Arrowhead, Sep 21 to Sep 29; the latest is Frontenac, Oct 18 to Oct 26." · ontariofall.com forecast, Oct 19
"Every peak window ontariofall.com publishes is frozen each Monday into a log that cannot be edited afterwards, then scored against what actually happened once the season ends." · ontariofall.com, Oct 19
"The model is corrected every day by people who are actually there: the Wilderness Union community, who are on the ground, and readers who file what they saw. Every report is read by a person before it can change a forecast." · ontariofall.com, Oct 19
Attribution required: ontariofall.com, with a link to the region page quoted. We do not claim to be the most accurate tracker. We publish our scorecard instead: how accurate were we?
Last updated Sun, October 18, 2026.
Machine readable
GET /api/status.json → 26 locations · stage, peak window, confidence, source, source date
On request, same day
Season curve, per location (SVG or raw daily values)
Frozen prediction log (CSV)
A cut of the forecast for one region or one weekend
An interview about how the model works and where it fails
Charts and data: CC BY 4.0. Camera frames: not ours to license, go to the named source on each location page. Reader photos: reproduce only with our written OK. Underlying sources carry their own terms and we pass them through rather than absorb them: the Ontario Parks fall colour report, Ontario 511 open data, per-camera licensing from each operator, and weather from Weather data by Open-Meteo.com under CC BY 4.0.
Who runs this
ontariofall.com is built and run by Wilderness Union Inc., a Toronto outdoor community that leads over a hundred guided trips a year into Ontario’s wild places, from the Don Valley to Temagami.
Wilderness Union runs fall trips to some of the locations on this map and they are marked as such.
Every ground report, whether it comes from a guide or from a reader, is reviewed by a person before it appears and is dated and credited on the location page it affects. The full methodology documents every source and what the model gets wrong.
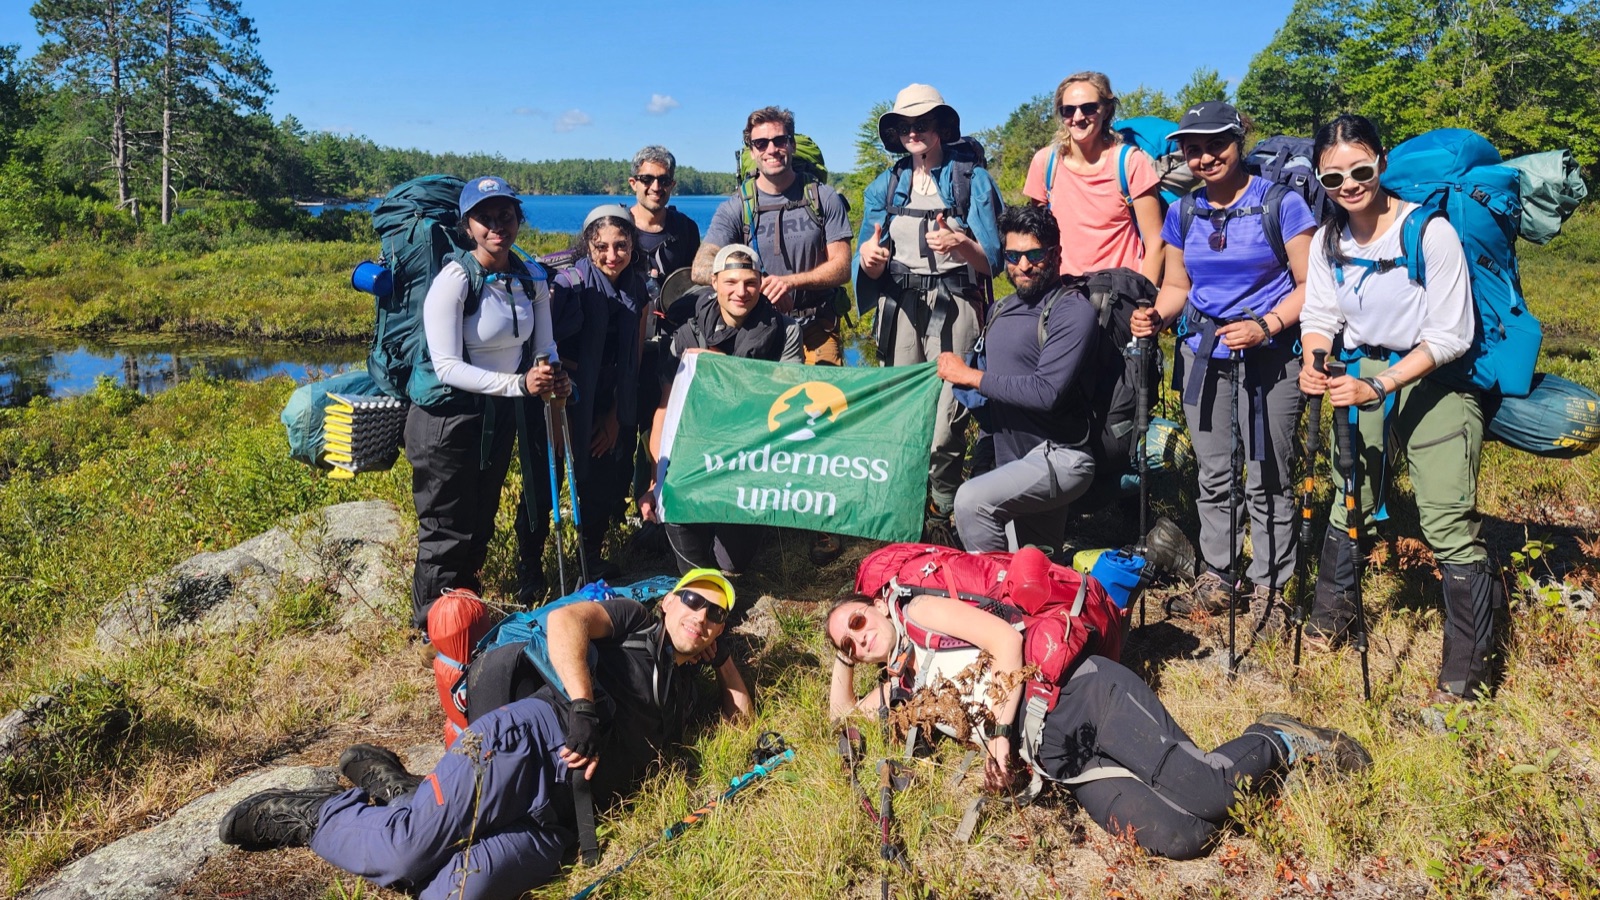
Members on a backpacking weekendWilderness Union
Put the map on your site
The live map, for the whole province or framed on one location. It updates itself, so a post written in September still shows the right colour in October. Free to use, including commercially, with the credit line left in place.
Paste both lines. The link under the map is the credit we ask for, and it is what makes the embed worth carrying for us: an iframe on its own passes no link.
Live preview. This is the embed itself.
What is actually different here
It is a forecast, not a status report
Every location carries a predicted peak date with a confidence band, recalculated daily from cold night accumulation, September warmth, summer drought and frost events. The model is rules based and explainable, so any change comes with a plain-language reason.
We measure colour off camera frames
Where a camera licence allows it, one frame a day is saved and reduced to a green chromatic coordinate over a fixed crop. That gives an objective daily colour curve per location that nobody else in Ontario publishes.
We grade ourselves in public
Every Monday in season, that day’s predicted peak windows are frozen into a log that cannot be edited afterwards. After the season, the scorecard compares those frozen calls against what happened, broken down by how far ahead each call was made. Hit or miss, it goes up.
Observed and predicted are never blended
Anything measured is labelled with its source and date. Anything modelled is labelled predicted. That distinction is visible on every screen on the site.
Reports are crowdsourced from people who are out there
The forecast is actively moved by reports from the ground. Wilderness Union runs trips through the fall, most weeks of the season, in many of the places on this map, so a location here can move days before a weekly park report catches up. Readers file too and a person reads every report before it appears.
Every location we track
26 locations · 14 camera views
Each has its own page with a peak window, its sources and their dates.