How this is made
Everything on this site is either something we observed or predicted and is always labelled as one or the other. Here is where each of those comes from, and who does the observing.
Who makes this
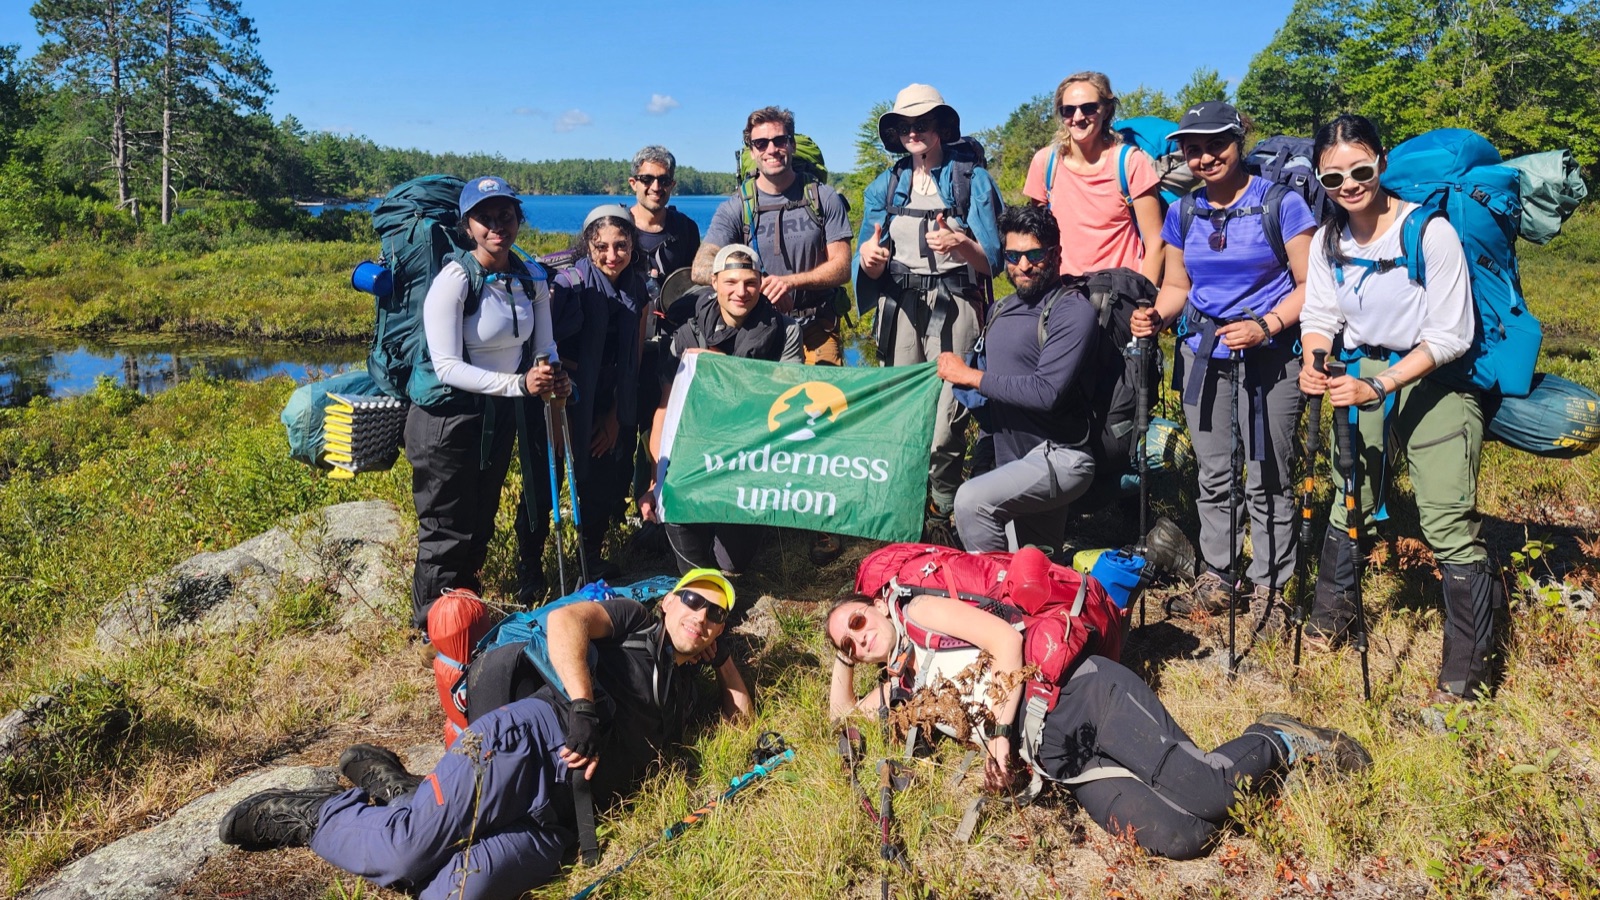
ontariofall.com is built and run by Wilderness Union, a Toronto outdoor community that leads more than a hundred adventures a year into Ontario’s wild places, from the Don Valley to Temagami.
We made it because we needed a forecast and up until now, there have only been reports. We’re often driving 4 hours to reach the best views so getting it right is super important, and nothing out there would commit to a date.
So we built something that commits to one. 26 locations, a peak window for each, recalculated every morning, frozen every Monday, and graded in November.
The people who keep it accurate
A model can tell you what a run of cold nights usually does to a sugar maple but you can’t be sure until you see it for yourself. That part is people, and there are three groups of wonderful humans who make this work.
The Wilderness Union member community and guides
Wilderness Union runs trips every weekend of the fall, in many of the places on this map. Our community files what they actually saw: the stage of the canopy, which species turned, how far along the leaf fall is. Their reports are named and dated like every other source on the site, and they are the reason a location can move before a camera or a park report catches up.
Park staff
The Ontario Parks fall colour report is written by the people who work in these parks. It is the province’s canonical source and it takes precedence over our own model wherever a park maps to a location we track.
Readers
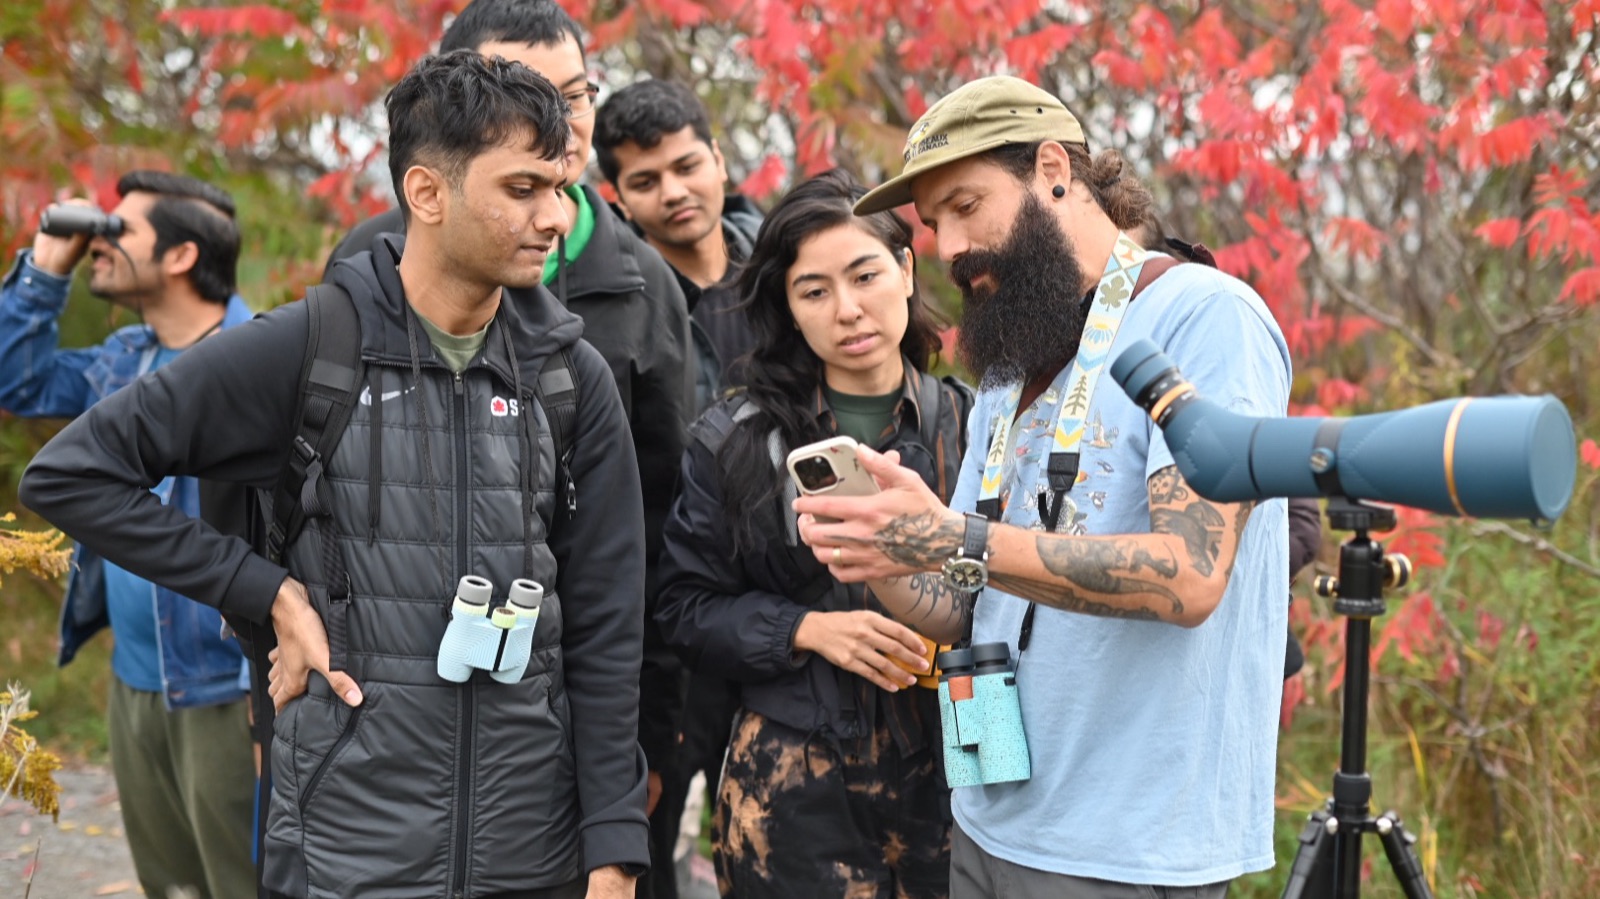
Anyone can send a report. A person reads every one before it appears, and reports from contributors we have verified carry a ✓ Verified on the ground badge. How all three are weighted against the model is in What we predict, below.
What we observe
- Ontario Parks fall colour report. Polled once a day. It gives percentage colour change, percentage leaf fall and viewing notes for each provincial park, updated roughly weekly by park staff. This is the province’s canonical source and it takes precedence over our own model wherever a park maps to a location we track. Note that this is freely available to all and we’re not affiliated with the parks. ontarioparks.ca/fallcolour
- The Friends of Algonquin Park report. Narrative detail for Algonquin, including the species split between the sugar maple peak and the later poplar and birch peak.
- Discover Muskoka for regional Muskoka status.
- Reports from people on the ground. Anyone can send one. Every report is reviewed by a person before it appears.
- Webcams. Live and near-live views from Ontario 511 highway cameras, NAV CANADA aviation weather cameras, the Windy webcam network, and local businesses who have given us permission. Every camera is credited and linked. Where a location has no camera of its own we show the nearest one and say how far away it is. If you run a camera in a region we do not cover, get in touch.
The 6 stage scale
No change, starting, patchy, approaching peak, peak, past peak. Ontario Parks percentages map onto this scale by colour change, with leaf fall deciding whether a location is at peak or past it. A canopy that is 90 percent turned but half fallen is over, not at its best.
What we predict
Every location has a modelled colour curve anchored on a predicted peak date. Each day the model starts from that location’s historical peak window and adjusts it:
- Cold nights. The primary driver. Nights below 7°C since August 20, compared with the ten year pace. Running ahead advances the peak, running behind delays it.
- Warm September. A September running above normal delays the turn.
- Summer drought. A dry June to August advances the peak and mutes it.
- Hard frost. A night at or below −2°C pulls everything forward.
Then the model assimilates what we can actually see. Where observations disagree with the curve, the curve moves toward the observations, weighted by how much we trust the source and how recent it is. A damped share of that correction carries to neighbouring locations in the same region, because colour does not stop at a park boundary.
Weather data by Open-Meteo.com, licensed CC BY 4.0.
The camera colour index
For cameras that allow it, we save one frame per day and measure how green the vegetation still is, as a green chromatic coordinate over a fixed crop of the frame. That produces a daily, objective colour curve per location that is independent of anyone’s judgement. Night, fog and heavy precipitation frames are discarded. It is a deliberately simple measure and it is sensitive to the camera moving, so we treat it as one input among several rather than as truth.
The Weekend Score
Out of 10 for each of the next three weekends. Six points come from the predicted colour stage on the Saturday and four from the weather forecast for that weekend. A peak weekend of cold rain scores lower than a near-peak weekend of sunshine, because the score is meant to answer where to actually go, not just where the colour is.
What this gets wrong
Every one of these is measured rather than hedged, and the numbers are current.
- 10 of our 26 locations have no Ontario Parks report of their own and read the nearest park instead, from 9 km away at Copeland Forest to 82 km at Temagami. Bruce Peninsula reads Sauble Falls, 35 km down the shore. We name the park on every location’s page, and since 31 August 2026 a borrowed reading counts for 50 per cent of what a local one does. Before that it counted for the same, and it pulled Bruce Peninsula’s forecast three and a half weeks early.
- A forecast can hit its own limit. Nothing is allowed to move more than 14 days from a location’s historical peak, so one bad input cannot send a date into November. When a location reaches that limit the published date is not a measurement, it is where we stopped. Those forecasts carry a visibly wider confidence band, which is the only way a clipped forecast looks clipped.
- Only Algonquin rests on a real historical record, the Friends of Algonquin Park sugar maple record since 1973. The other 25 baselines are offsets estimated from it and from published regional norms, and they carry no claimed range. They improve each season.
- Our weather is modelled, not measured at the location. It is reanalysis on a grid roughly 9 km across, so a valley bottom and a peak share one figure, and rainfall is the variable it gets least right. Summer rainfall is also our strongest single driver, worth up to 6 days. If one number is going to be wrong, that is the one.
- How much drought advances a peak is not yet validated. Summer 2025 was the driest in our ten year record and Algonquin still peaked close to normal. That is one season and not a calibration, but it is a reason to treat a large drought-driven shift with suspicion until the scorecard says otherwise.
- The camera curve should be read for its shape, not its height. Each camera’s greenness is scaled against its own observed range for the season, so the curve fills the chart whether the change was dramatic or slight, and two locations are not comparable to each other. A fixed reference per camera is the fix and it is not built.
- Peak dates more than about two weeks out are weak. The confidence band widens with distance, and it is wide for a reason.
- We treat a location as one canopy.
- Locations with no nearby park and no camera lean almost entirely on the model. Killarney, Bon Echo, Frontenac and Silent Lake are the thinnest.
When we get one wrong we say so here and in the end of season scorecard.
Keeping ourselves honest
Every Monday during the season we freeze that day’s predicted peak window for every location into a log. After the season we publish a scorecard comparing those frozen predictions against what actually happened. Hit or miss, it goes up.
Using this data
/api/status.json returns current status, sources and forecast outputs for every location. Free to use with attribution to ontariofall.com and a link back. If you are writing about this and want something we do not publish, ask.
A note on spelling
For those visiting from elsewhere, we use the European colour spelling. Color is used by our neighbours to the South.